Hi everyone,
I wanted to share an example on how to include a Chart tagging element in your report template. If you’ve ever struggled with structuring your data for charts, this might help!
To demonstrate, I’ve prepared a sample template along with the XML example, that shows how to use the Chart tagging element. One key requirement is ensuring your data structure is correctly formatted for the chart to work properly.
Example Data Structure
Let’s say you have multiple categories, each containing three data fields. The XML structure should allow you to retrieve the full collection of category records, where each category has a name and some values. Here’s an example of it in XML document:
<data>
    <graph>
        <category point="1 Jan 2023" datapoint="1" datapoint2="1.2"/>
        <category point="1 Feb 2023" datapoint="1.1" datapoint2="1.4"/>
        <category point="1 Mar 2023" datapoint="2" datapoint2="1.6"/>
        <category point="1 Apr 2023" datapoint="1.3" datapoint2="2.1"/>
        <category point="1 May 2023" datapoint="1.5" datapoint2="1.5"/>
    </graph>
</data>
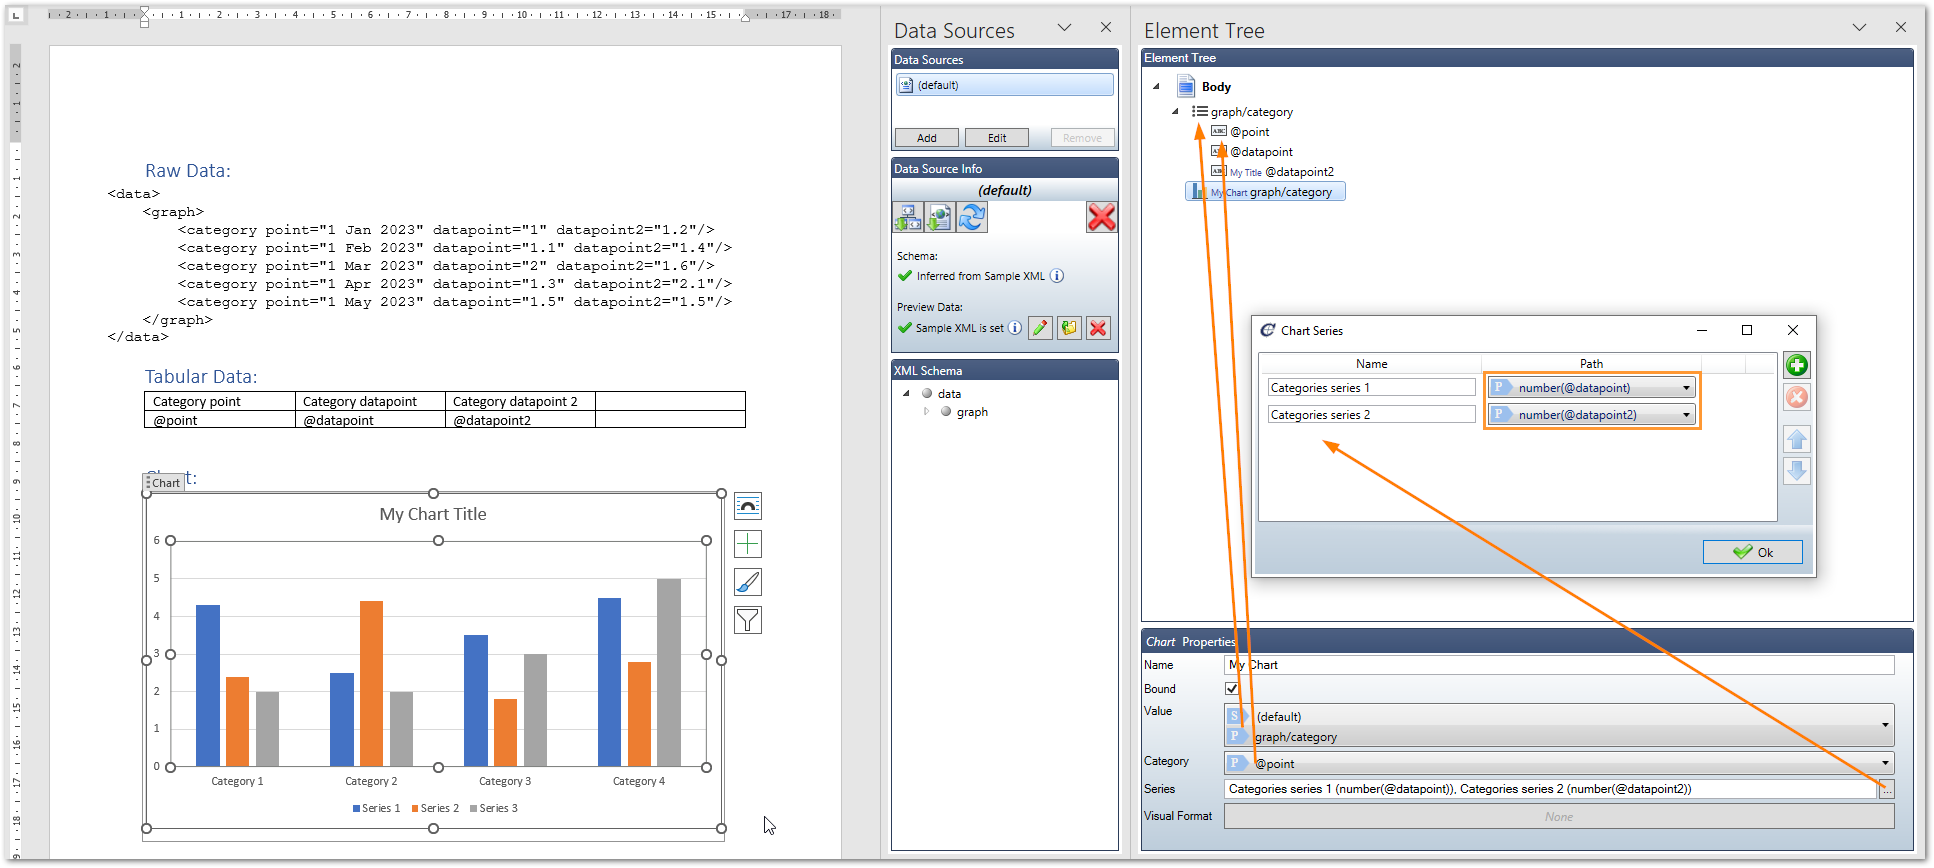
I added datapoint and datapoint2 to show how to include multiple series in the graph.
Key Takeaways
- The category elements should have attributes for category names and values for all series.
- In the Chart Series dialog, we use the
number()function in the XPath expression. Without it, XPath assumes values are strings (since no data schema is provided), which can cause issues. Usingnumber(), the values are cast into decimal format, allowing the graph to interpret them correctly.
Here is a screenshot illustrating the bindings.
If you’re working with chart elements in your reports, you can give this a try!
Please note that Docentric fully supports the following chart types: Column, Line, Pie, Bar, and Area. The other chart types are either partially supported or not supported.
Charts are only supported when using Word as an output file format. Generating a PDF document will not include charts. You can however use another approach and Call Office Conversion Services to generate PDFs from Docentric AX reports.
You can dowload the report template example here: test_chart.docx (42.9 KB)