
Scenario explanation
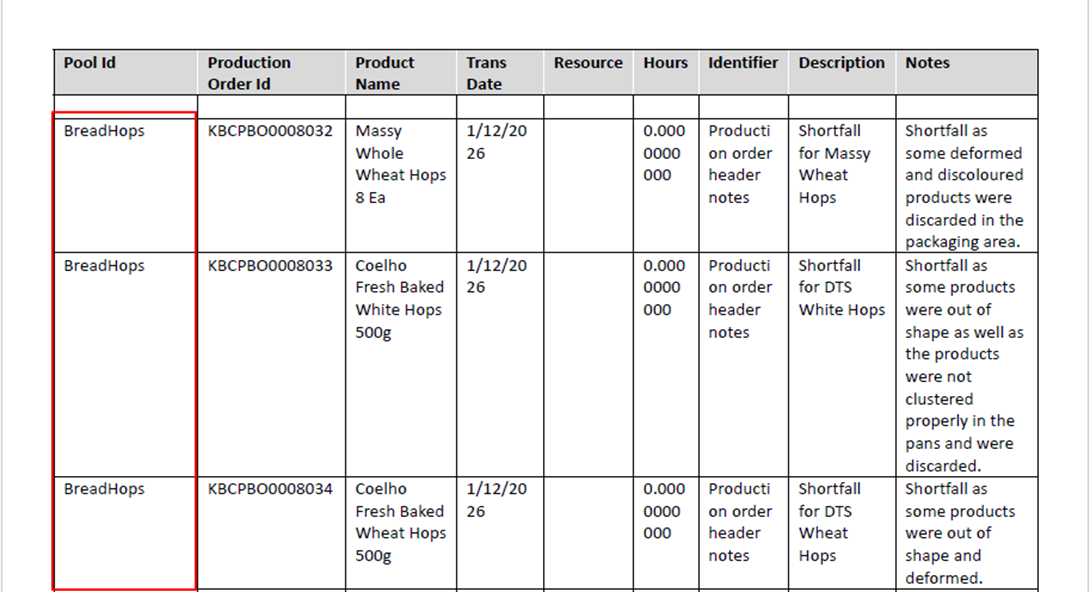
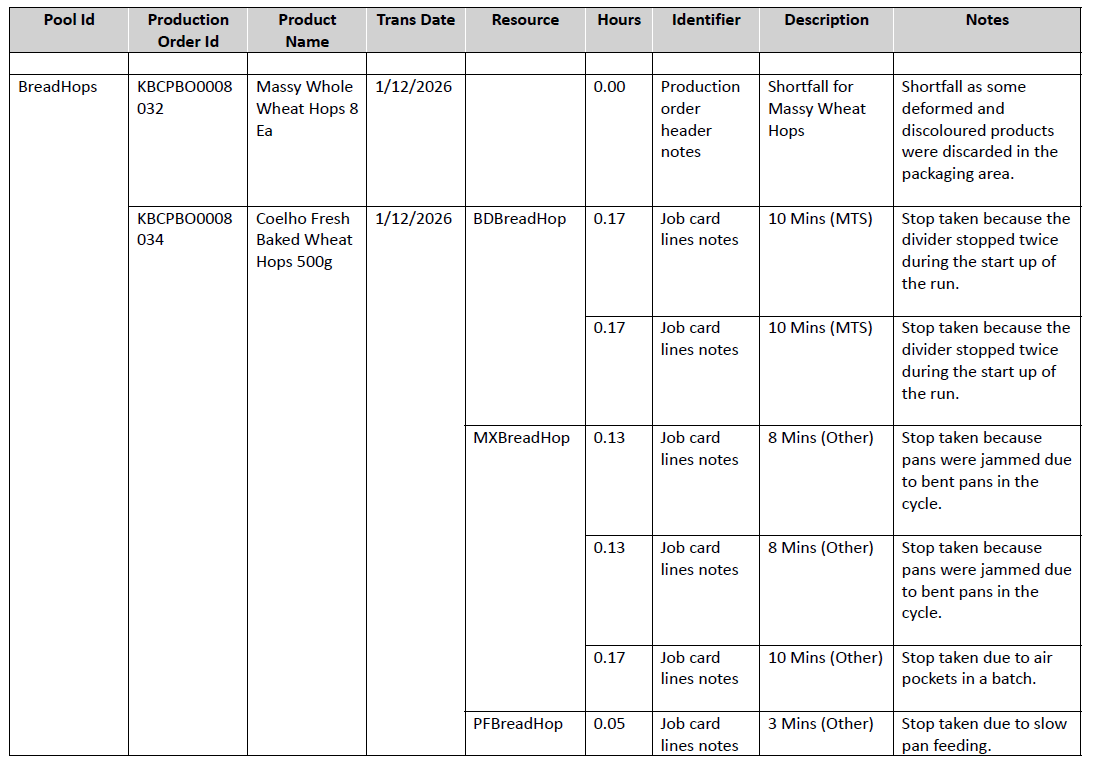
This post discusses a scenario that requires specific design techniques in Docentric AX Designer. The screenshot below shows the desired final report.
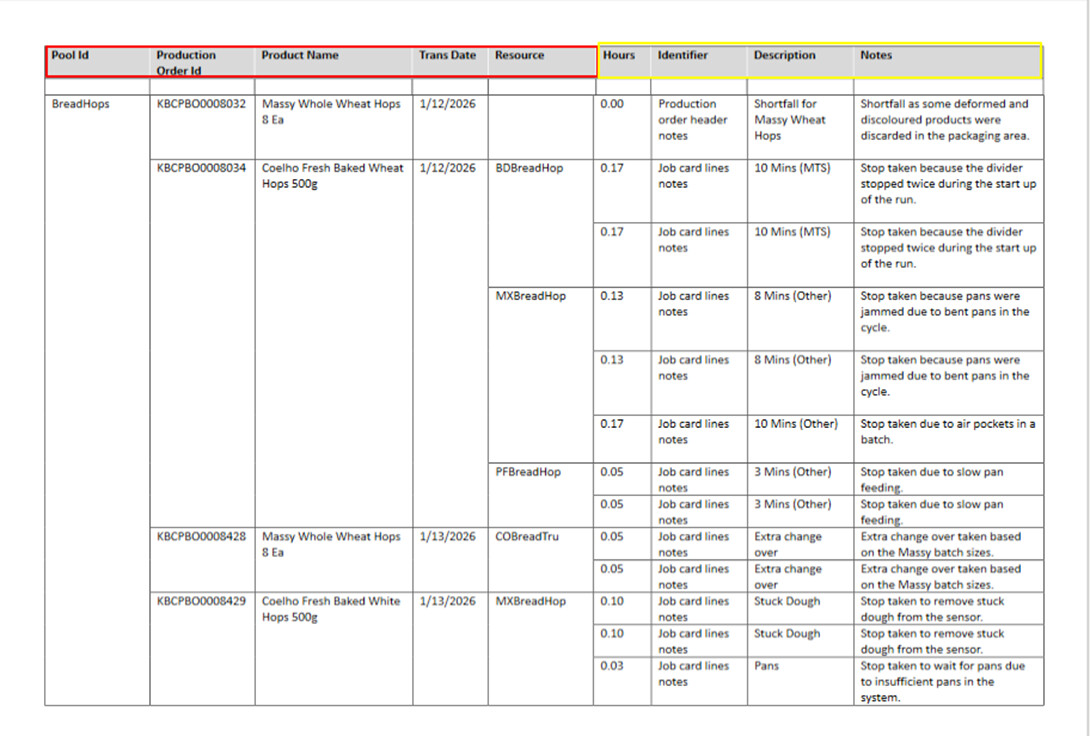
The report uses a table where repeating values are displayed only once. Initially, the user may think that nested Group tagging elements could solve this by setting the Pool id field as the key for Group 1, the combination of Production order id, Product Name, and Trans Date as keys for nested Group 2, and Resource as the key for nested Group 3. These fields, marked with a red frame in the screenshot above, represent potentially repeating group values.
The fields marked with a yellow frame represent detail values, which are always visible. However, Group tagging elements work hierarchically, so the group key value appears in one row and the group data appears in subsequent rows.
This creates a vertically separated layout, which does not match the required design, so a different approach is required.
Before moving on to the report design let’s take a look at our data source, which was imported from the DDSP file.
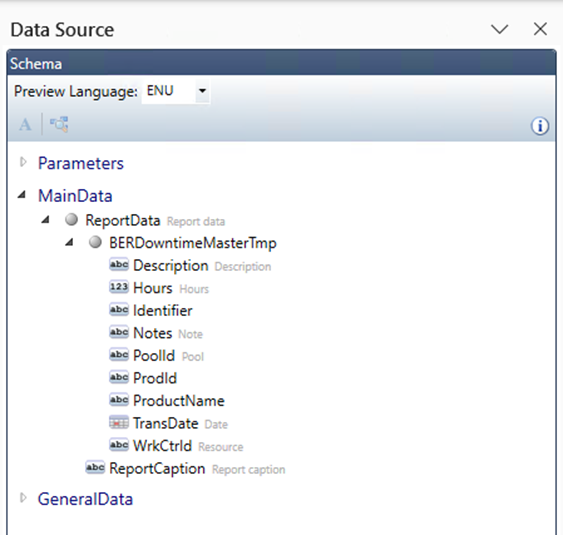
The DDSP data source contains a flat collection of BERDowntimeMasterTmp records.
If we preview the MainData in the Data Source pane, we can see that all rows exist at the same hierarchical level.
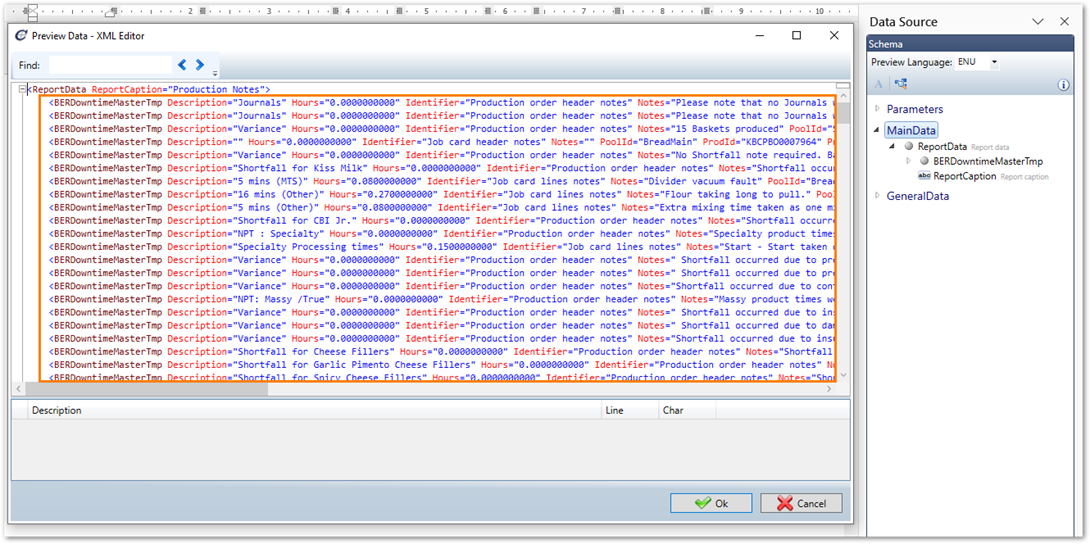
This flat structure makes it possible to simulate grouping behavior manually using variables and conditional visibility.
Report template design
Instead of using Group tagging elements, we will use the following approach:
- Landscape page orientation with narrow margins .
- Raw table design with a header and adjusted, fixed column widths.
- Design the Border Logic.
- Bind the data with the List tagging element and apply sorting.
- Add Var tagging elements and conditional content logic.
- Test the template.
1. Landscape page orientation with narrow margins
In Microsoft Word create a new document, navigate to Layout > Orientation > Landscape, then select Layout > Margins > Narrow.

2. Raw table design with a header and adjusted, fixed column widths
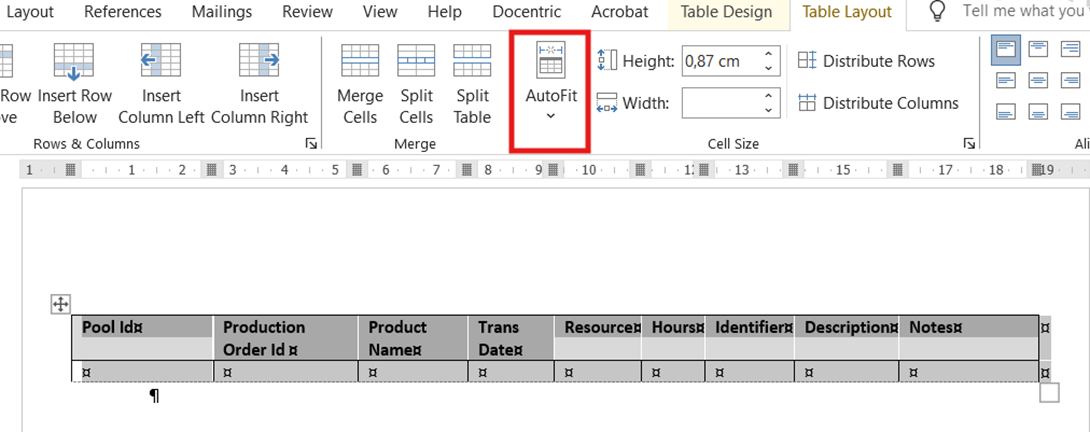
Insert a new table with 9 columns, 11 rows and set Table Layout > Autofit > Fixed Column Width.
Describe the header column with labels and adjust column widths.
3. Design the Border Logic
To simplify the solution logic this is a brief explanation of grouping mechanism.
Considering multiple rows with the same PoolId value, the expected result is to display the PoolId value only once, hide repeated occurrences and keep related details rows visually grouped.
This is the requested result.
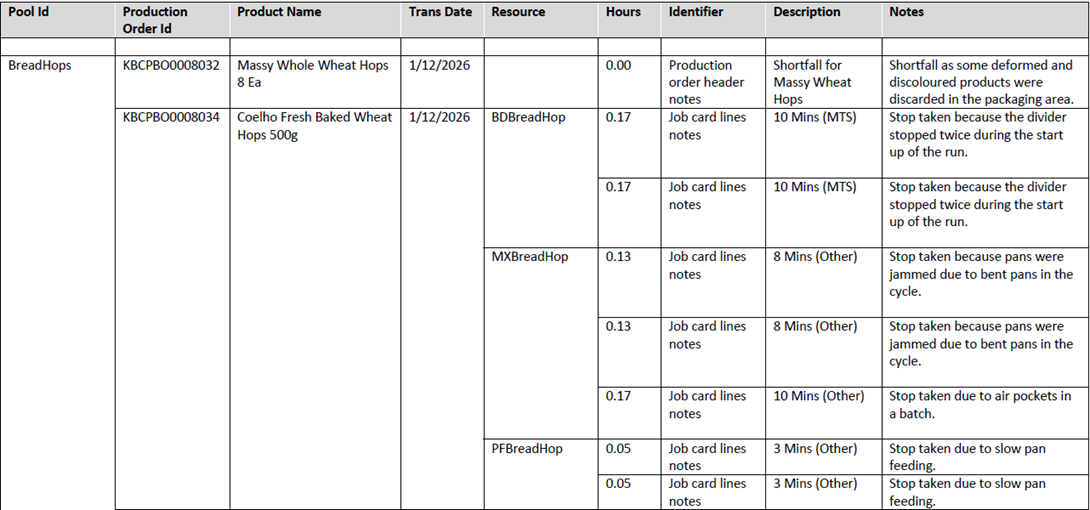
As described in the previous section, we define combinations of displayed group fields and related group details by comparing the values between the current and previous records. If the group fields are the same as in the previous record, we do not show them. If they are different, we show them because a new group is starting.
| Scenario | PoolId | ProdId + transDate | Resource | Hours+Identification+Description+Notes |
|---|---|---|---|---|
| 1 | Show | Show | Show | Show |
| 2 | Show | Show | Show | |
| 3 | Show | Show | ||
| 4 | Show |
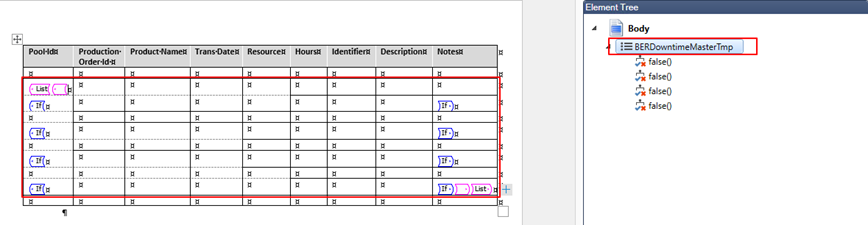
Now let us add two table rows for each combination and set the underline borders accordingly. We need two table rows for each combination to set independent borders. The second table rows, highlighted below, will always be hidden, as shown in the screenshots below. The entire rows are selected and wrapped in the If tagging element using the false() function, which always returns false and thus hides the row.
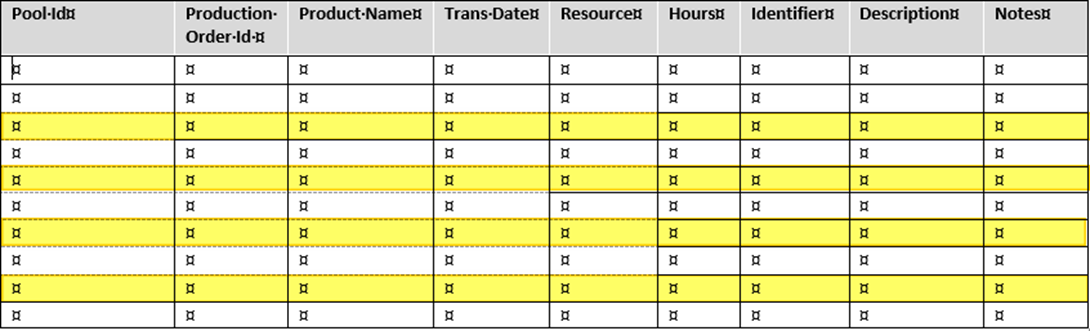
Here we see how rows are wrapped with If tagging elements, when we enable the Docentric AX > Show Tags button in the menu.
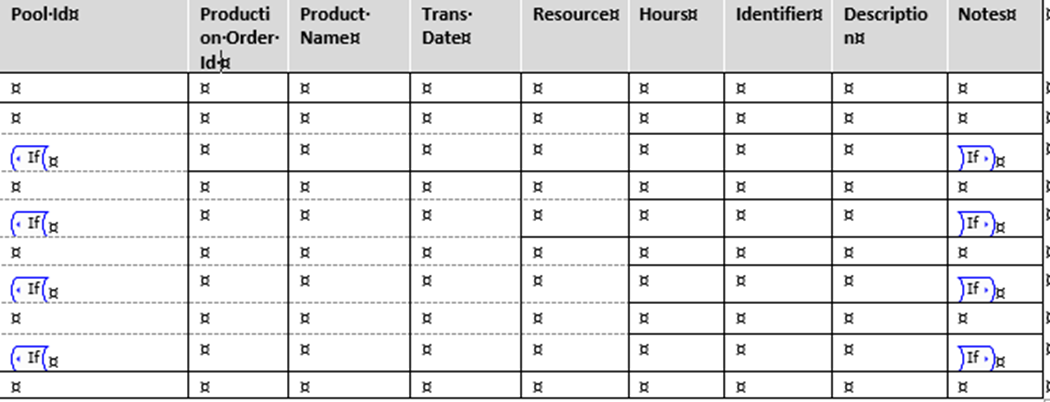
4. Bind the data with the List tagging element using sorting
Wrap table rows in the red frame with a List tagging element then bind the list to the BERowntimeTmp.
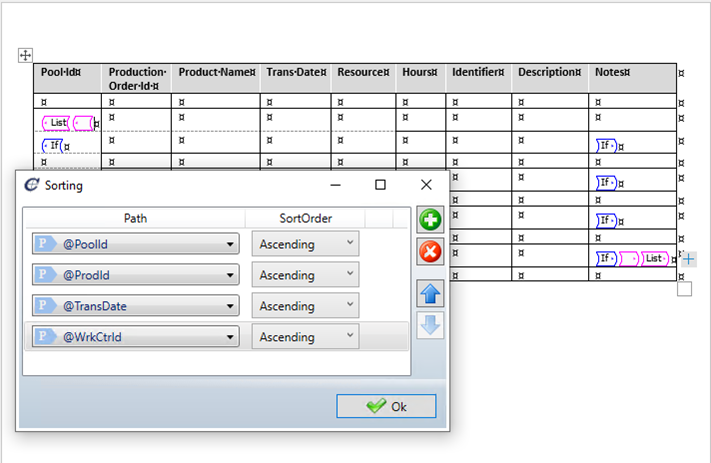
Apply sorting to the list tagging element with the following fields in ascending order.
5. Add Var tagging elements and conditional content logic
In the next steps we are going to use three Var tagging elements named as follow:
| Variable name | Variable type |
|---|---|
| ExPoolId | String |
| ExProdId | String |
| ExResource | String |
These variables store values from the previous row, allowing us to determine whether the current row needs to introduce a different group scenario or continue the previous one.
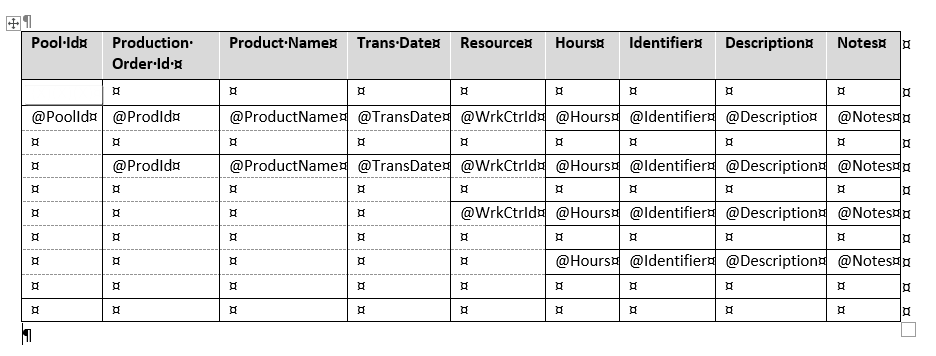
Bind the list cells using Field tagging element as shown below.
For each processed record, update the variables with current row values.
| Variable | Binding value |
|---|---|
| ExPoolId | @PoolIdPoolId |
| ExProdId | (concat(string(@ProdId), string(@TransDate)) |
| ExResource | @WrkCtrld |
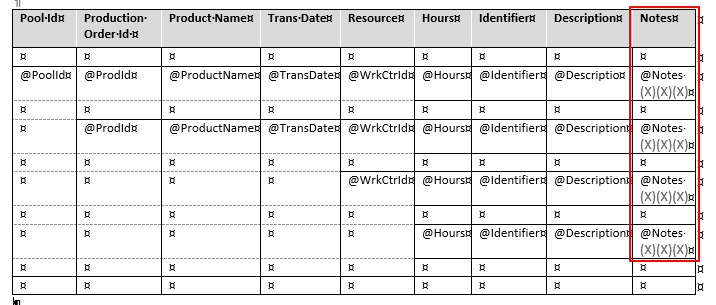
Each repetition scenario is handled using a dedicated table row and the IF tagging element.
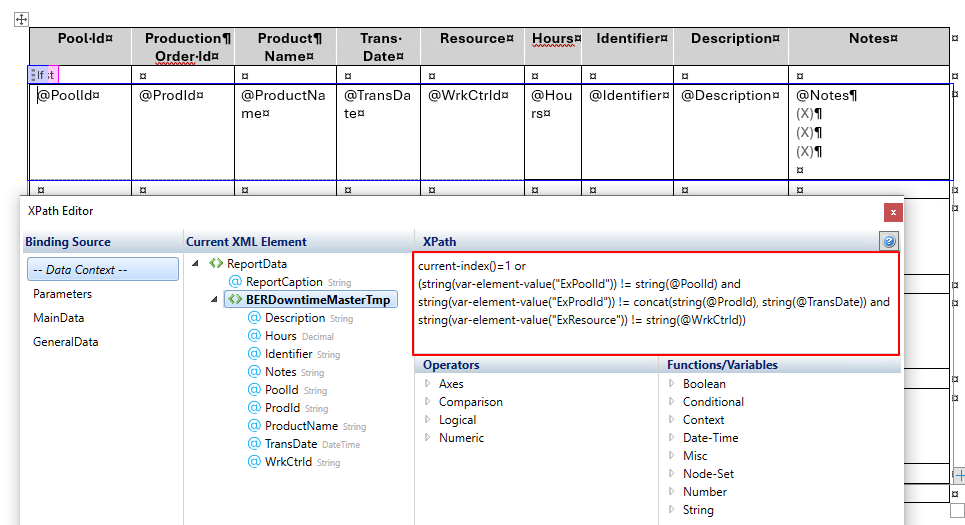
Scenario 1: All groups reset when PoolId changes
Wrap the first list row with an IF tagging element using the appropriate condition.
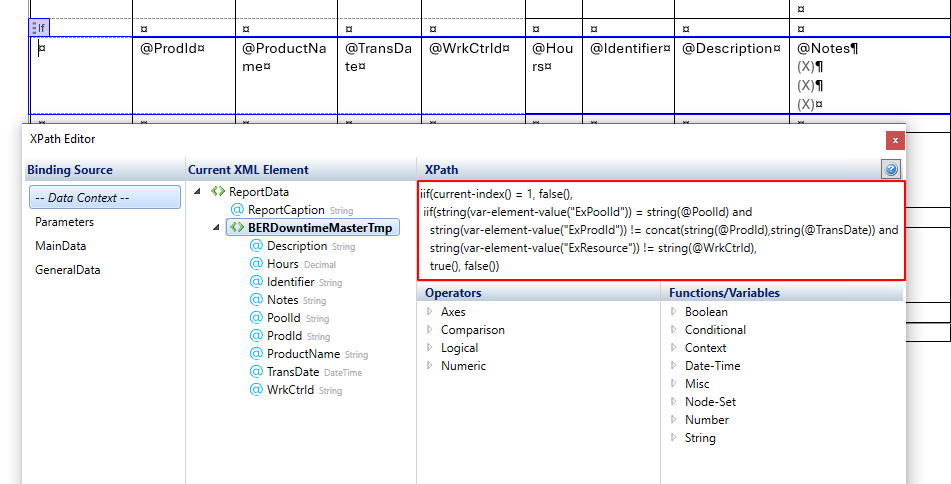
Scenario 2: PoolId stays the same, ProdId and TransDate change
Wrap the IF tagging element around the list row with the empty PoolId cell and apply the conditional expression as shown below:
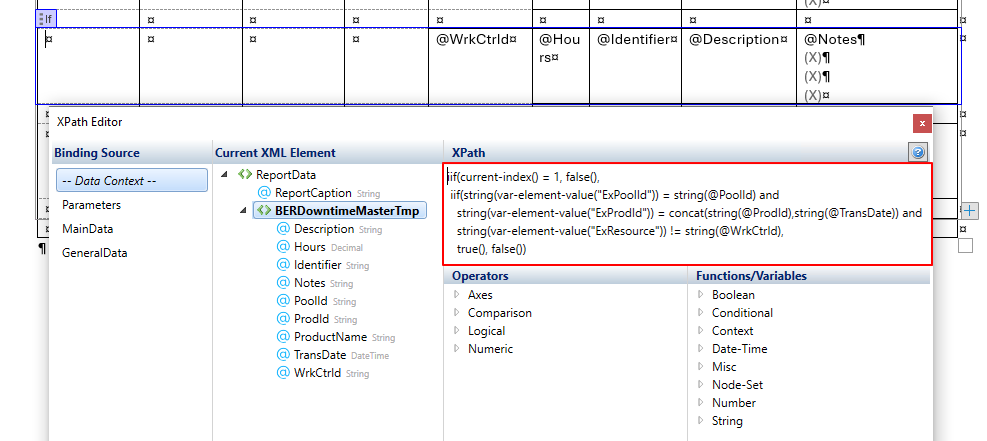
Scenario 3: PoolId and ProdId+TransDate stay the same, WrkCtrId changes
Wrap the IF tagging element around the list row with empty PoolId, ProdId, ProductName, and TransDate cells and apply the conditional expression as shown below:
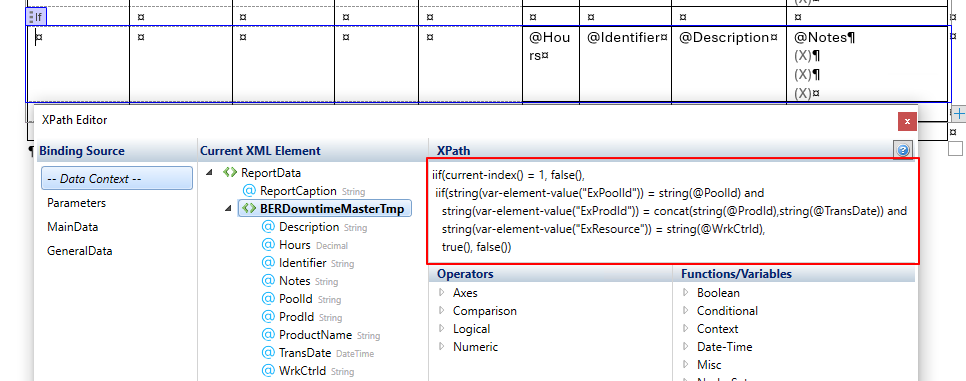
Scenario 4: All group fields stay the same
Wrap the IF tagging element around the list row with empty group field cells (PoolId, ProdId, ProductName, TransDate, and WrkCntrId) and apply the conditional expression as shown below:
7. Testing the template output
After configuring all scenarios, preview the report and check border rendering.
Here you can download the finished template:
ProductionListReportTemplate.docx (52.4 KB)