There was a request to show a running total for each page. But the problem is that Microsoft Word doesn’t really know where a page ends, so we can’t do this in a simple way. This happens because when the report is running and the table is filled with data, we don’t know in advance where the page will break, so we can’t just add the running totals automatically. However, there’s a workaround that we can use with Docentric AX Designer.
![]() So, how can we do this? Let’s break it down step by step:
So, how can we do this? Let’s break it down step by step:
First, we need to create a counter. We start with 0 for both the counter and the running total. For each printed line, we:
- Add 1 to the counter
- Add the line amount to the running total
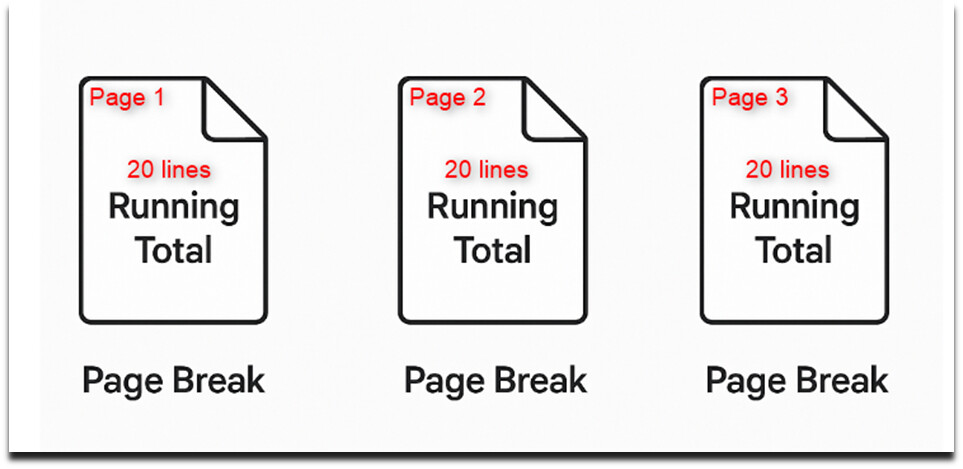
Next, we calculate the current line number using something called “modulo” — basically, we check the remainder when we divide the line number by the number of lines that fit on one page.
When the result is zero, that means we’ve reached the end of a page. At that point, we can:
- Force a page break
- Show the running total
This trick lets us show totals after a set number of lines, which works like showing running total per page, even though Word doesn’t actually know where pages break. We force the page structure by inserting a page break after a fixed number of lines. The running total is cumulative and it grows page by page as more lines are printed.
![]() Let’s now build this in Docentric Designer
Let’s now build this in Docentric Designer
Step 1: Prepare sample data
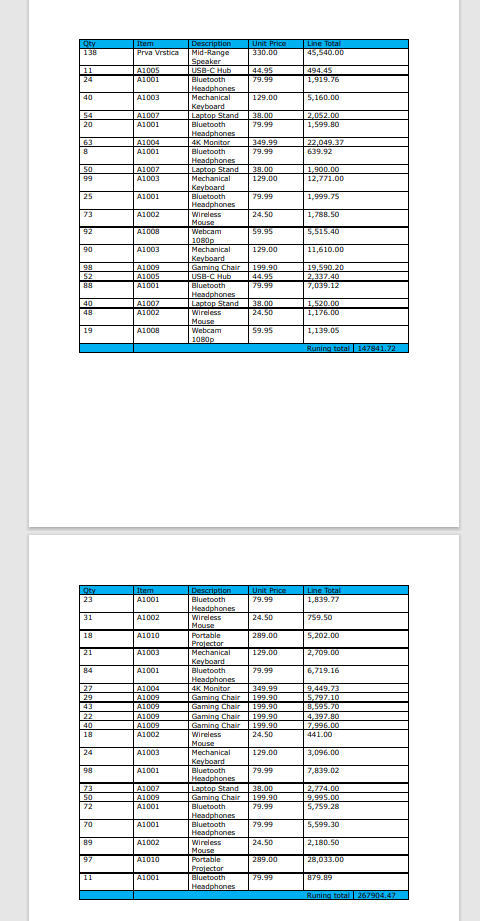
I have prepared sample data in my DDSP (Docentric Data Source Package) file that contains at least 150 transaction lines.
This will ensure that the template handles multiple pages correctly, with a new page triggered every 20 lines.
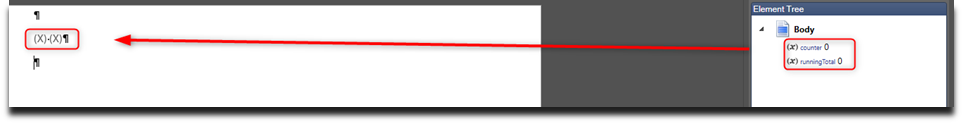
Step 2: Add variables to the template
At the beginning of the template, I will add two Var tagging elements. One will count how many lines have been printed. We will call it counter. The other will keep adding the amount from each line and show the total at the end of the page. We will call that one runningTotal.
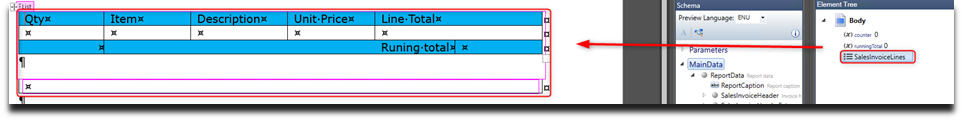
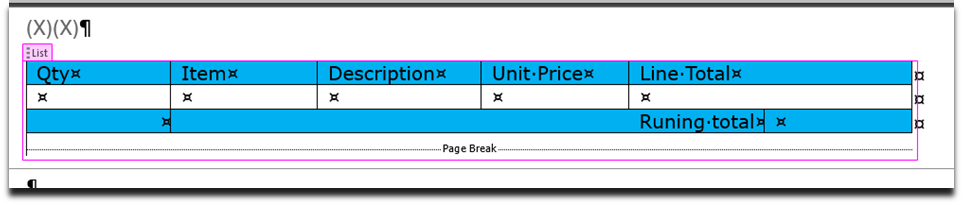
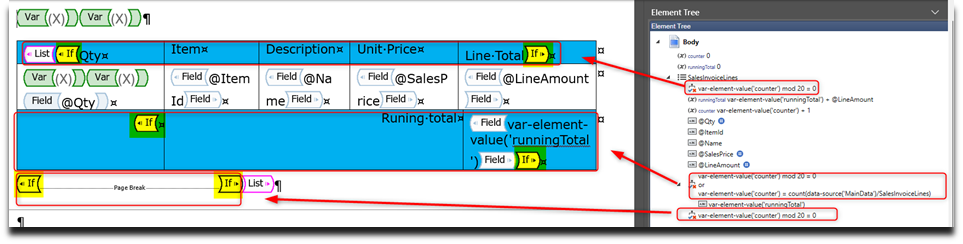
Step 3: Insert the List Tagging Element
Now that you added the two Var tagging elements (for counter and running total), it’s time to build the table for invoice lines.
Here’s how to set it up:
- Add a table with:
- One header row (for titles like Item, Quantity, Price, Total)
- One line row (for invoice data)
- One footer row (to show the running total)
- One empty line (where we’ll add a page break)
- One second table (just a helper to fix page break, we’ll delete it later)
- Select everything except the first two Var tagging elements.
- Click Insert List from the Docentric AX Designer toolbar. This wraps the row in a List element.
- Bind the List to the collection of data — in my case it will be SalesInvoiceLines.
That’s it! Now your line row will repeat for each invoice line, and we’re ready to set up the page break and running totals.
It should look like this.
Step 4: Add a Page Break
In the empty line (the blank paragraph between the two tables), insert a Page Break to define your page layout.
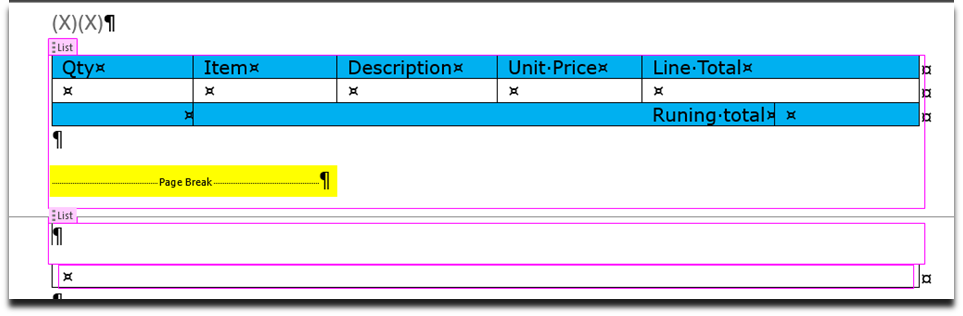
After that, delete the second table (the one used to help with layout) and remove any extra empty lines.
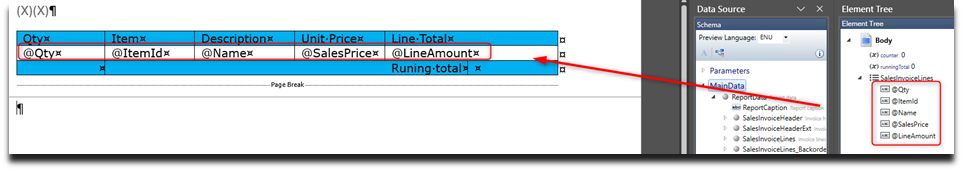
Step 5: Add Field tagging elements for item and amount
Inside the table row, insert five Field tagging elements: Qty, Item, Description, Unit Price, and Line Amount.
These fields will display the line values for each item.
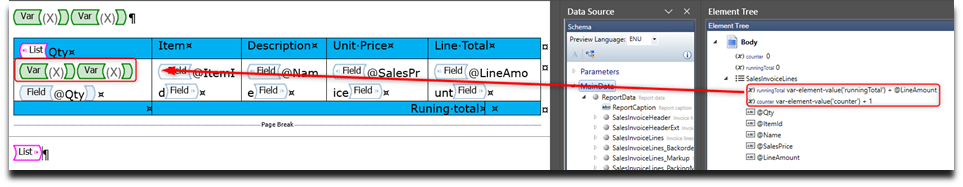
Step 6: Update variables with XPath expressions
Now it’s time to use the Var tagging elements inside the table row where the transaction lines are shown. We will use XPath expressions to update the values automatically as each line is printed.
The counter variable will go up by one for each line. The runningTotal variable will keep adding the amount from each line. This helps us keep track of how many lines are on the page and the total amount for that page.
XPath expression for counter var tagging element :
var-element-value('counter') + 1
XPath expression for runningTotal var tagging element :
var-element-value('runningTotal') + @LineAmount
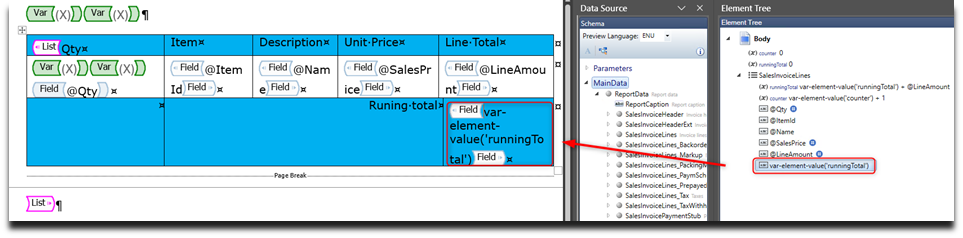
Step 7: Display the Value of the Running Total
Now we will show the value of the runningTotal variable.
Add a new Field tagging element to the end of the table.
Use the var-element-value() XPath function to display the current value of the runningTotal variable.
The XPath expression you should use in the footer is:
var-element-value('runningTotal')
This expression will print the total amount calculated for the current page.
Step 8: Add If tagging element
Now it’s time to show the table header, running total, and insert a page break, but only after every 20 printed lines and also at the end of the report.
To do this, wrap each of these elements (header, total, and page break) inside an If tagging element with a condition.
We use the modulus (mod) operation to check if the current line number is a multiple of 20:
var-element-value('counter') mod 20 = 0
However, the last page might not contain exactly 20 lines. If we only use the mod condition, the final running total would not be shown at the end.
To solve this, we add another condition that checks if the current line is the last one in the report. We use the count() function to get the total number of invoice lines and compare it to the counter:
To fix this, we combine it with another check — whether the current line is the last line. For that, use the count() XPath function and compare it with the counter:
var-element-value('counter') mod 20 = 0
or
var-element-value('counter') = count(data-source('MainData')/SalesInvoiceLines)
Important: We use data-source(‘MainData’)/SalesInvoiceLines because we need to leave the current line context and count all invoice lines in the main data source. If we did not do this, the count function would only see the current record.
This way, the running total and page break will appear after every 20 lines and also at the very end of the report, even if the last page has fewer than 20 lines.
Once everything is ready, you can play around with the formatting. Try changing the row height and table size to see how many lines fit on one page. After testing and adjusting a few things, I finished the final design. I’ve attached the version I used.
page-level-totals.docx (58.9 KB)
We are done.
Summary of XPath Functions Used
var-element-value(‘VarTaggingElement’)
Used to read the current value of a variable.
We used this to get the values of counter and runningTotal during template rendering.
mod
Used to calculate the remainder after division.
count( SalesInvoiceLines**)**
Used to count the number of nodes in a list or collection.
We used this to get the total number of invoice lines and compare it to the current line number, so we know when we’re on the last line.
Example:
count(data-source(‘MainData’)/SalesInvoiceLines)
data-source(‘…’)
Used to switch the XPath context to a specific data source.
We used this to step out of the current line (which is deep in the hierarchy) and access the full list of invoice lines from the top-level data source named “MainData”.