Tracing
With the Docentric Tracing framework you can trace:
- SSRS and Docentric report execution,
- Posting and printing process,
- Loading Print management settings,
- Printing reports via DRA,
- Alert notifications.
Tracing is by default disabled. You can turn it on by Trace category or Trace action. Trace categories and Trace actions map more or less to above listed functionalities.
Tracing, when enabled for a particular Trace category, collects useful information whenever a supported Trace event occurs so you can review and analyze it later.
Collected tracing data is saved to all enabled Trace destinations. Currently, two types of Trace destinations are supported: Infolog and Database – more specifically, the DocTraceTable table.
On the other hand, when tracing is enabled for a particular Trace action, it usually performs that action (for example, dumping a Docentric template), and it is not affected by Trace destinations nor Trace events.
Trace parameters are configured in the DocTraceParam table.
How to set up Trace parameters
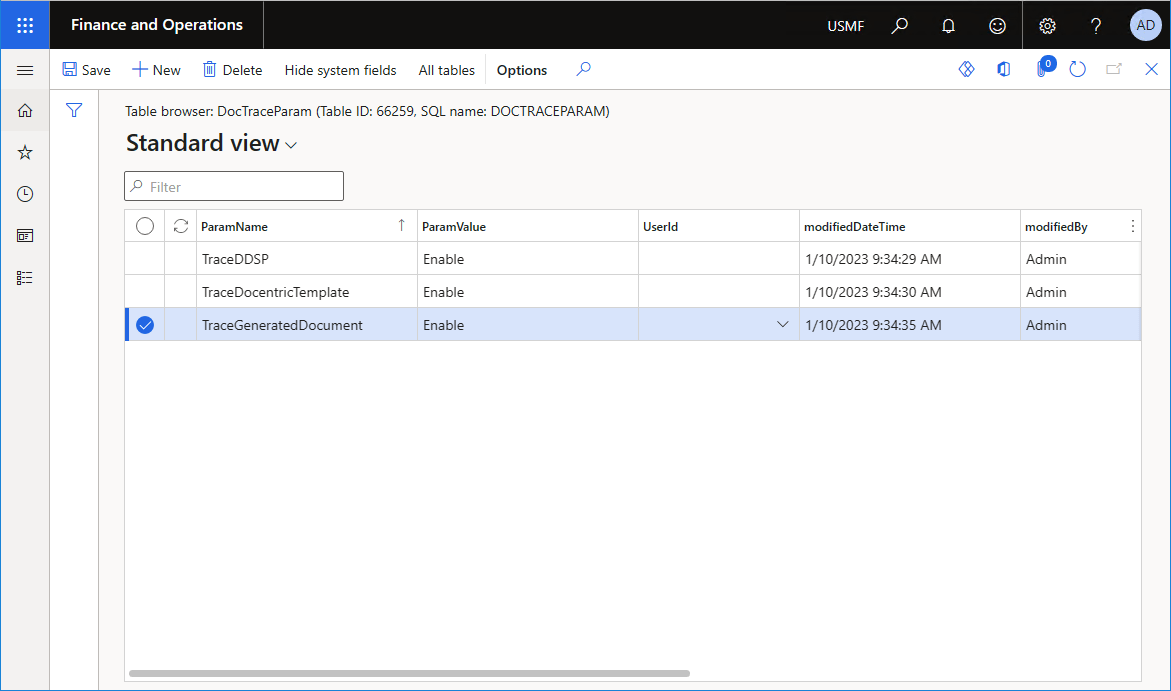
Trace parameters can be configured in the DocTraceParam table.
https://usnconeboxax1aos.cloud.onebox.dynamics.com/?mi=DocTraceParam
(NOTE: the first part of the address is environment-specific).
The DocTraceParam menu item opens Docentric Table Browser which is the same as the built-in Table Browser except for one thing: it enables editing of Docentric system tables such as DocTraceParam and DocentricEngineSetting in non-development environments for users with the Docentric AX Administrator role. Learn more >>
The DocTraceParam table has a smart logic when adding new Trace parameters.

Add a new trace parameter by clicking New and then click Save before adding the next one. Repeating this procedure will eventually add all available parameters.
Trace parameters are disabled by default. To enable them, the Parameter value field must be set to Enable.

Of course, Trace parameters can also be added manually by entering Parameter name and Parameter value.
The following Trace parameters are supported:
- Trace destinations:
- TraceToDatabase
- TraceToInfolog
- Trace categories:
- SSRS
- DOCENTRIC
- REPORT_EXEC_TIMES
- POSTING
- POSTING_PRINT
- PRINTMGMT
- ALERTS
- Trace actions:
- TraceDDSP
- TraceDocentricTemplate
- TraceGeneratedDocument
- DRADocument
Trace destinations
There are two Trace destinations where tracing information can be stored:
- Database, where all tracing information is saved to the DocTraceTable table. Tracing to database is enabled if the TraceToDatabase trace parameter has value Enable.

- Infolog, where tracing information is displayed in Infolog (Message bar or Action center). Tracing to Infolog is enabled if the TraceToInfolog trace parameter has value Enable.


While it may be handier to have tracing information stored in the database due to the filtering and sorting ability, seeing information directly in Infolog can quicker give you some answers. Of course, both options can be used at the same time.
The fields in the DocTraceTable table:
- System fields: CompanyId, UserId, ThreadId, SessionId, BatchJobId, BatchJobTaskId.
- TraceCategory, e.g. SSRS, DOCENTRIC, PRINTMGMT, ALERTS.
- TraceEvent, e.g. START, END, ON_PRINTMGMT_LOAD, NOTIFICATION_CREATED.
- MessageSeverity, e.g. Info, Warning, Error.
- Message, e.g. SSRS report design name, Alert table name, Journal table name.
- TraceContextInfo1 .. TraceContextInfo7: fields with context information depending on Trace category and Trace event, e.g. print settings, target print destination, template ID, report parameters, execution IDs.
Trace SSRS and Docentric report execution
Now that we enabled tracing to both trace destinations - Infolog and Database, we can trace report execution by enabling the SSRS and DOCENTRIC trace parameters:
- SSRS will trace an SSRS report execution to any SSRS print destination except the standard Screen destination. It works also when printing reports via Docentric print destinations, since the initial part of the pipeline is always the SSRS pipeline.
- DOCENTRIC will trace report execution only if a Docentric print destination is used. This also includes redirections from SSRS Screen to Docentric Screen, triggered by the Use Docentric design and viewer flags in Docentric report setup. Learn more about this redirection >>
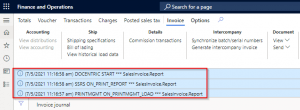
To test the SSRS and DOCENTRIC trace parameters, we will print an invoice from (Customer) Invoice journal. Configure Print management setup to print Customer invoices to Docentric Email, open Invoice journal and click the Invoice tab > Document > View > Use print management.
Tracing information will appear in both Infolog and the DocTraceTable table.


Trace report execution times
From 3.4.4 version, you can trace report execution times, for now only for reports executed via Docentric print destinations. This includes reports generated using both Docentric templates and SSRS report designs. In Trace parameters enable the REPORT_EXEC_TIMES trace category as well as tracing to Infolog and database (the DocTraceTable table) to see the tracing results.
Currently, there is a single trace event - EXEC_COMPLETED, which occurs when a report execution completes, with three report execution times logged:
- dspClass = the report DSP class execution time. DSP class is responsible for creating the report DDSP (data source) but also for handling placeholders used in print destination settings, loading additional report attachments (e.g. for emailing) and processing SharePoint metadata. Note that pre-processed reports such as Sales invoice already have the data prepared once their DSP class is executed, while regular and query-based reports don’t, so for such reports the DSP class will actually perform the data fetching. Thus, the duration of a DSP class execution also depends on the report type.
- docGen = document generation time in the target output format (PDF, Word, Excel, EMF). This covers document generation using both Docentric Document Generator and SSRS Reporting Services, if the target print destination is a Docentric destination. Document generation time includes also applying electronic signature, if configured so.
- total = dspClass + docGen + report distribution time. Report distribution time is time spent on emailing, saving to Azure Blob storage, etc., depending on the target print destination settings. Report distribution time includes also document encryption and saving to Print archive, if configured so.


In one of the future releases, we will add more fine-grained measurements regarding DDSP generation, document signing and report distribution methods as well as collect execution times before the Docentric pipeline starts. Namely, the latter would be useful to measure the duration of data fetching for common reports such as Sales invoice or Purchase order, since they are pre-processed reports and this measurement is not included in the dspClass execution time.
Trace posting and printing
We can also benefit from tracing when it comes to posting-and-printing related issues. The relevant trace parameters are:
- POSTING, which will trace posting transaction starts and ends.
- POSTING_PRINT, which will trace printing in the posting process.
When posting multiple documents (e.g. sales orders), the reports can be posted and printed one-by-one, or all of them can be posted first and then printed. This behavior depends on the Print options configured on the posting dialog (Current and After), please see the image below. It’s important to understand this because a printing error in batch will terminate the batch job and the rest of the documents will not get processed (posted-and-printed for Current or printed for After).

To test this, go to All sales orders and post in batch at least two invoices by selecting Generate > Invoice.
On the posting dialog, if we set Printing parameters > Print options > Print to:
- After, the printing will take place after the posting of all documents. Trace will look like this: POSTING trace for all documents first, then POSTING_PRINT trace at the end.

- Current, each document will be printed separately after the posting and before the next document is posted. Trace will look like this: POSTING and POSTING_PRINT traces are triggered separately for each document.


Trace Print management
Next is the PRINTMGMT parameter, which traces the Print management framework when printing reports with Print management preview or Use print management options.
We can test the PRINTMGMT parameter by opening the (Customer) Invoice journal and go to Document > View > Use print management to print the selected invoice.
When printing is executed, we will see a trace with the Event name=ON_PRINTMGMT_LOAD and Trace category=PRINTMGMT.
The trace message in Infolog:

The trace record in the DocTraceTable table in the database:

It contains more useful information than Infolog, such as Name of the used print management setting, the target print destination, number of copies and if exists, the condition query based on which this print management setting was selected for printing the report.
Learn how to configure Print management tracing in greater detail >>
Trace cloud printing (DRA)
The DRADocument trace parameter is a little bit different from the rest since it does not store the traces to Infolog or the database. Instead, it will enable us to see the content of the document sent to a Network printer by dumping all involved files in the browser.
To test this, we will print a document to a network printer using Docentric Printer print destination. The files uploaded in the cloud that will later be fetched and printed locally by Document Routing Agent (DRA) will also be downloaded to the browser.

The download consists of a single XML file (with printing information such as margins and orientation, one per document) and multiple EMF files (document content, one per page).
![]()
You can open and investigate these files to check if the files sent to the printer are correct.
Learn more >>
Trace report generation
From the 3.4.5 version on, you can trace report generation by dumping the following report execution files in the browser:
- Runtime DDSP file - if the trace parameter TraceDDSP is set to the value Enable. Dumping is done for reports generated from both Docentric templates and SSRS report designs.
- Used Docentric template (a Word document) - if the trace parameter TraceDocentricTemplate is set to the value Enable. Dumping is done only for reports generated from Docentric templates.
- Generated report file (in the selected output format) - if the trace parameter TraceGeneratedDocument is set to the value Enable. Dumping is done for reports generated from both Docentric templates and SSRS report designs.

Once in the future, we will support dumping to the database or Azure Blob storage, which will enable dumping report execution files also in batch.
(1) TraceDDSP to dump the runtime DDSP file if you need to troubleshoot document generation based on Docentric templates or resolving placeholders in print settings.
(2) TraceDocentricTemplate to confirm which Docentric template exactly is used for document generation.
(3) TraceGeneratedDocument to troubleshoot document generation based on both Docentric templates and SSRS report designs.
Docentric print destinations that are not (fully) supported
- When printing to Generate DS print destination, dumping of report execution files IS NOT SUPPORTED.
- Docentric Printer print destination limitations:
- When printing to Docentric Printer print destination on premises, dumping of report execution files IS NOT SUPPORTED.
- When printing to Docentric Printer print destination in cloud with Print as PDF turned off, dumping of generated documents IS NOT SUPPORTED, while dumping of runtime DDSP files and Docentric templates IS SUPPORTED. In that case, please use the trace parameter DRADocument. Learn more >>
- When printing to Docentric Printer print destination in cloud with the Print as PDF option turned on, dumping of report execution files IS SUPPORTED.
- For tracing report execution files when printing to Docentric Memory print destination, the additional trace parameter TraceGeneratedDocumentInMemory should be enabled.
Runtime DDSP
Unlike design-time DDSP, which is generated via Docentric Generate DS print destination or by enabling DDSP generation in Docentric report setup, the runtime DDSP does not contain data source schema nor translations for all selected preview languages. Also, because the report DSP class might use a switch for runtime mode, it can happen the resulting report data differs in design-time and runtime DDSP files.
Trace alerts
We can also trace alert notifications and alert notification emails by enabling the ALERTS trace parameter.
This will trace two events:
- NOTIFICATION_CREATED - when an alert is triggered.
- DOCENTRIC_EMAILING - when an alert notification email is sent using Docentric, which happens if the Sent email using Docentric option on the corresponding alert rule is turned on. Learn more >>
In the case that an alert email should have been sent by Docentric, additional information on email processing (Batch email sending status), email sender and recipients will be logged in DocTraceTable as well as the error message, if any.
Let's create an alert rule by clicking Create a custom alert on the All purchase orders form (PurchTableListPage) to get an alert whenever the Warehouse field is changed:

Now, changing the Warehouse field will be creating alert notifications. Each time an alert notification is created, the NOTIFICATION_CREATED event will be traced.

Additionally, if the alert rule is configured with the Sent email using Docentric option turned on, the DOCENTRIC_EMAILING events will also be traced each time when an alert notification email is sent.

Note that you can pair the records with the NOTIFICATION_CREATED and DOCENTRIC_EMAILING trace events by using the EventInboxId value stored in the TraceContextInfo1 column of the DocTraceTable table.
Tracing for Alert summary emails is supported by the same trace category (ALERTS) and trace events (NOTIFICATION_CREATED and DOCENTRIC_EMAILING).
See also
Diagnostic Console >>
Trace HTTPS Requests and Responses in D365FO >>
Figure out your D365FO Print management setup >>